CS 5234 Advanced Parallel Computation, Spring 2013
Programming Assignment 4: Histogramming
Due: 11:59pm, March 18th, 2013 (Monday)
Introduction
The goal of this assignment is to
- be familiar with NVIDIA CUDA atomic operations.
- understand the performance issues for histogramming.
Description
You are asked to write a program to count number of nodes in several 2D regions. Here is the detailed description of the task.
In a 2D map of the central USA, there are over 10 million
locations, as we call them nodes. We need to find the density of these
nodes for different regions in the map. So the map is divided into a
rigid grid, and a count of the number of nodes in each grid cell needs
to be calculated, as illustrated in the following figure.
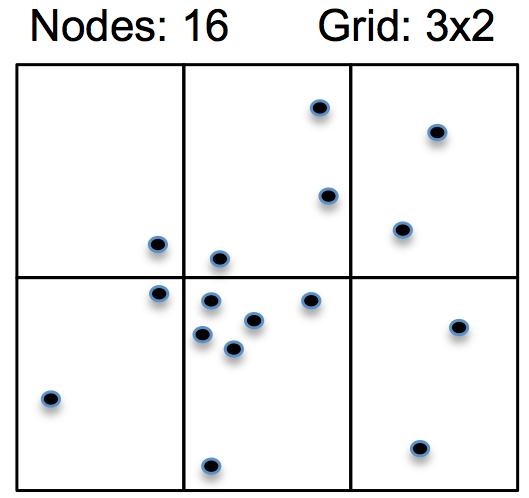
[0,0]:1
[0,1]:3
[0,2]:2
[1,0]:2
[1,1]:6
[1,2]:2
where each line represents on grid cell, [x,y] is the index of the cell, and number after ":" is the count of nodes in that grid cell.
Test Data and Format
An ASCII map file including 14,081,816 nodes is provide HERE.
The first line shows how many nodes in the file. The rest of the file includes the location data of the nodes. Each line has the format of "v $index $x $y", where "v" indicates the line is for a vertex position, "$index" indicates the vertex index, and "$x" and "$y" are the coordinate of the vertex.
Program input and output
The name of the executable file is "histo". Your program should take three parameter as inputs. The first one is the file name of the ASCII map file. The second one is the X dimension of the grid. The thrid one is the Y dimension of the grid. For example:
histo
USA-CENTRAL.nodes 100 50
Your program will be tested with three different grid sizes: 1000x500, 100x50, and 16x8.
Please note that the rigid
grid is evenly partitioned on both dimensions. And, the grid show cover
the all nodes, starting from the most left-top node to the most
right-bottom nodes. It means you need to find out the max and min value
for each dimension of the nodes, which should be done offline. (You can
write a CPU-version of the code, or you can use all software, such as
Excel, to find the max and min value).
Your program should print out the counting result with the
format shown in the description section above.
Your program should also print out the execution time for the following procedures of your program:
- Memory transfer from host to device
- Total
computation of the histogram counting.
- Memory transfer from device to host
- Overall execution: include input file loading and exclude printing out result.
What and how to submit:
Put your solution in one compressed file(zip or tgz),
including all
source files, makefile. Please also include a README file, if you have
specific instructions for how to compile or run your program. Please do
NOT include your test data file.
Please make sure your exe file is named as "histo" and exactly takes three
parameters. It will make the TA's grading task much easier.
To submit your assignment, simply upload your compressed file onto the the dropbox of the class scholar site.
Grading:
- Documentation and Readability (10%)
- Correctness (40%)
- Performance (50%)