1. The model is able to reproduce the wild type distribution of ParA, parS/ParB, PopZ and FtsZ.
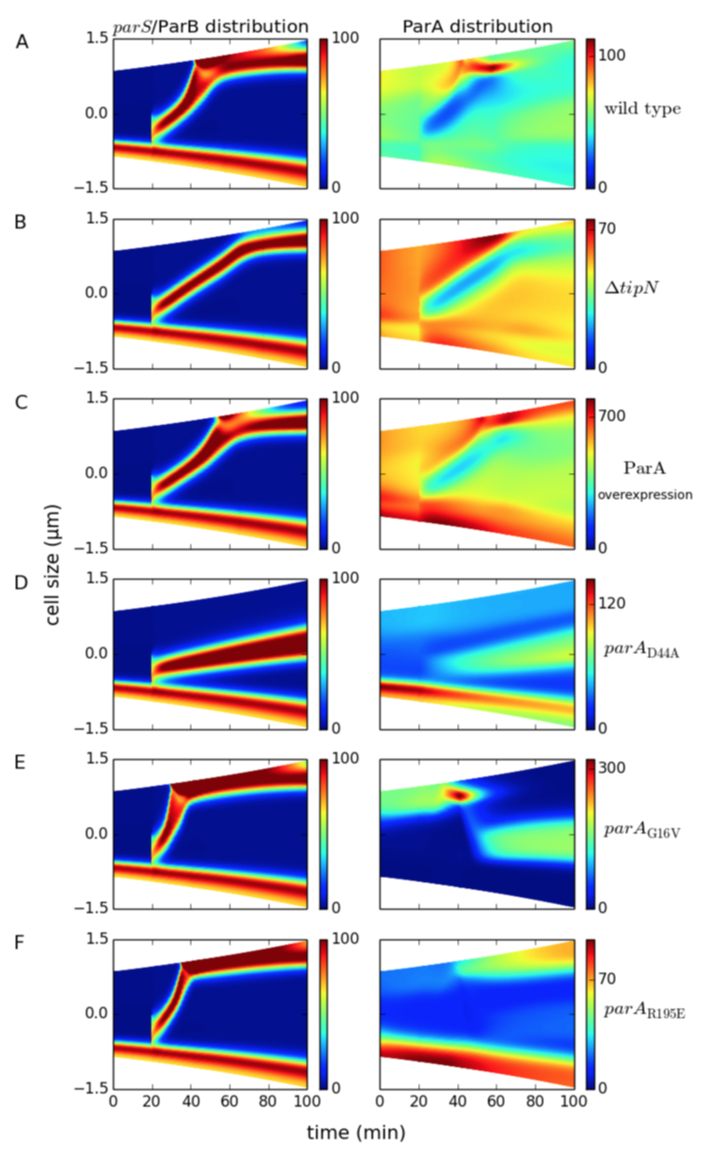
Figure 5.3: Spatiotemporal distribution of ParA (right panel) and parS/ParB chromosome fronts in wild-type and mutant cells. Colors indicate concentration gradients from minimum (blue) to maximum (red). (A) Wild type, (B) ΔtipN, and (C) ParA overexpression. (D) parAD44A mutants express ParAD44A proteins that cannot be hydrolyzed by ParB. (E) parAG16V mutants express ParAG16V proteins that cannot form dimers. (F) parAR195E mutants express ParAR195E proteins that cannot bind DNA.
2. The model reproduces delays in chromosome segregation and FtsZ mid-cell localization in ΔtipN and ParA overexpression background
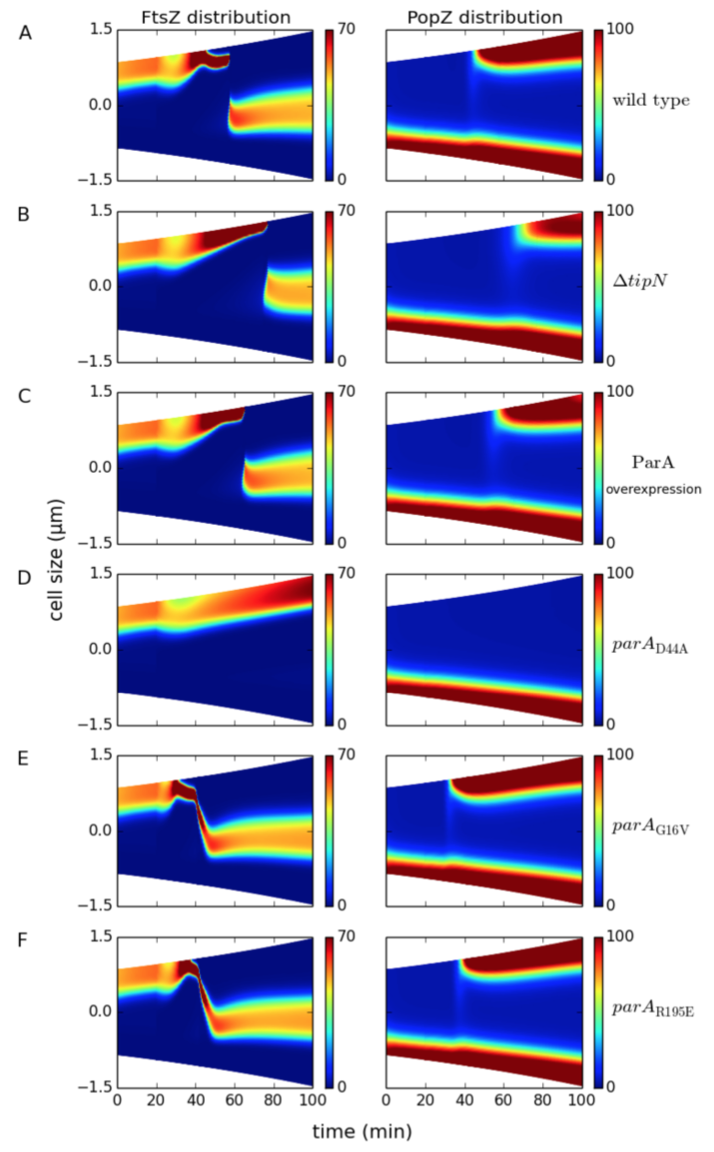
Figure 5.4: Spatiotemporal distribution of FtsZ (left panel) and PopZ (right panel) in wild-type and mutant cells. Colors indicate concentration gradients from minimum (blue) to maximum (red). (A) Wild type, (B) ΔtipN, and (C) ParA overexpression. (D) parAD44A mutants express ParAD44A proteins that cannot be hydrolyzed by ParB. (E) parAG16V mutants express ParAG16V proteins that cannot form dimers. (F) parAR195E mutants express ParAR195E proteins that cannot bind DNA.
3. The model reproduces aberrant localization of ParA mutants. PopZ may regulate chromosome segregation via binding ParA dimers instead of ParA monomers.

Figure 5.5: Centromere segregation requires PopZ to interact with the dimeric form of ParA. Colors indicate concentration gradients from minimum (blue) to maximum (red). The time taken for translocating the parS/ParB chromosome front (upper panel), and the ParA distribution profile (lower panel) are comparable between simulations of the (A) wild type strain, and (B) a mutant strain containing a PopZ variant that cannot bind ParA monomer (popZ-SP1). (C) Simulations of a strain containing a PopZ variant that cannot bind ParA dimers (popZ-SP2) shows that the parS/ParB segregation is delayed.
 webmaster