1. DivJ-dependent phosphorylation of DivK is crucial for switching PleC from a phosphatase to a kinase
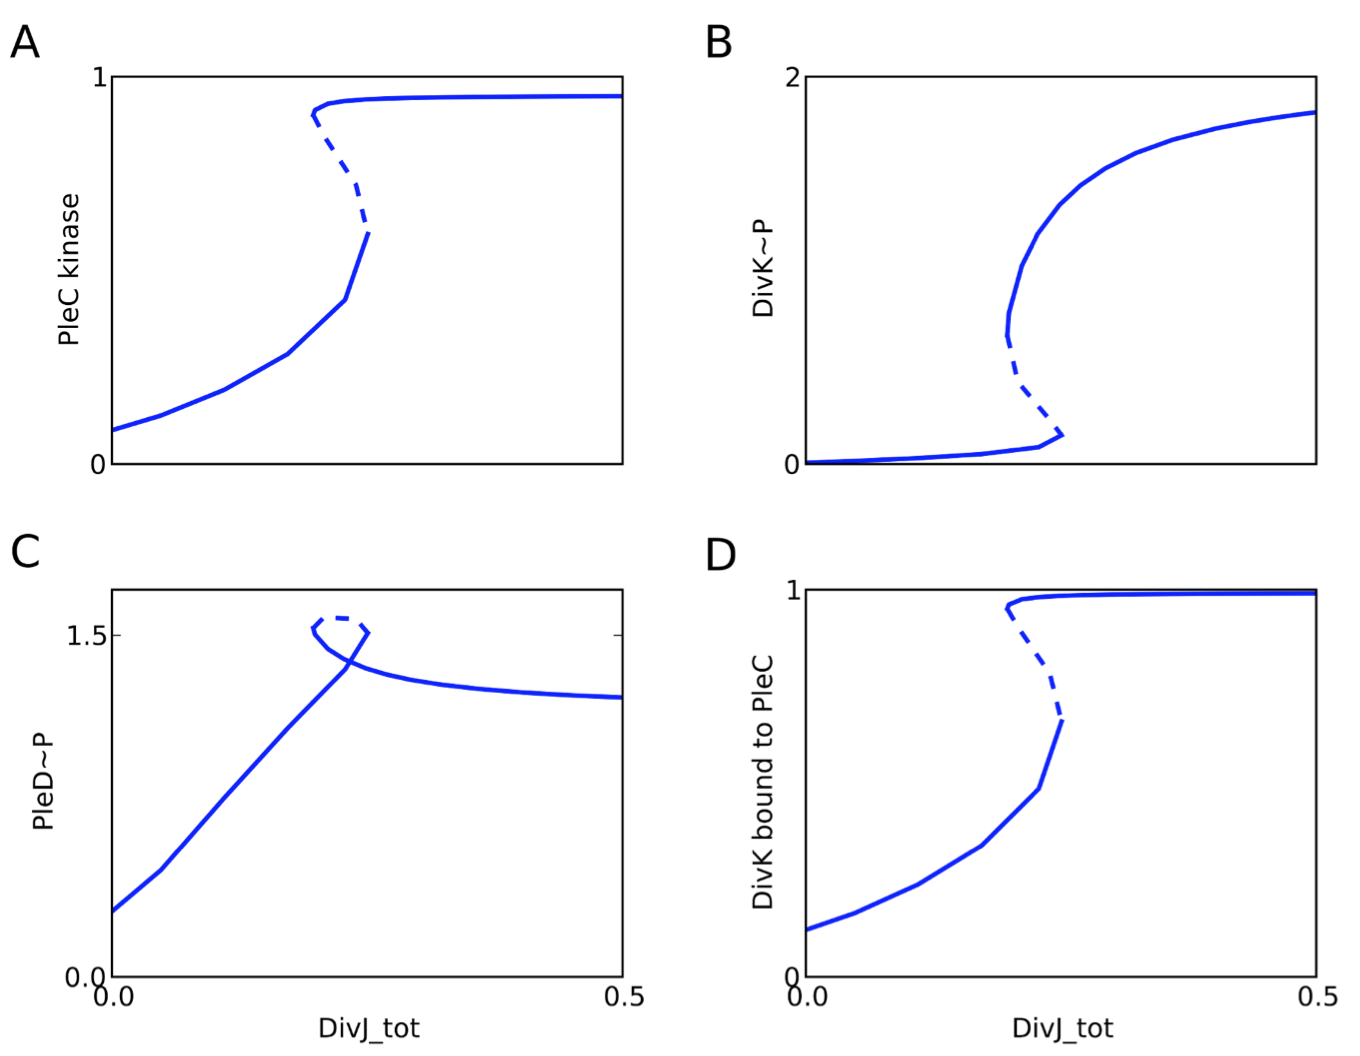
Figure 2.4: DivJ initiates the PleC phosphatase-to-kinase transition. For the full model, we plot signal-response curves (one-parameter bifurcation diagrams) for the steady state levels of (A) PleC kinase, (B) DivK~P, (C) PleD~P, and (D) DivK bound to PleC as functions of total DivJ (the parameter DivJ_tot in the model). Solid lines, stable steady states; dashed lines, unstable steady states. In our model, PleC_tot = constant = 1.0, but total DivK, total CtrA, and total PleD depends on DivJ_tot.
2. DivJ-dependent phosphorylation of DivK is crucial for switching PleC from a phosphatase to a kinase
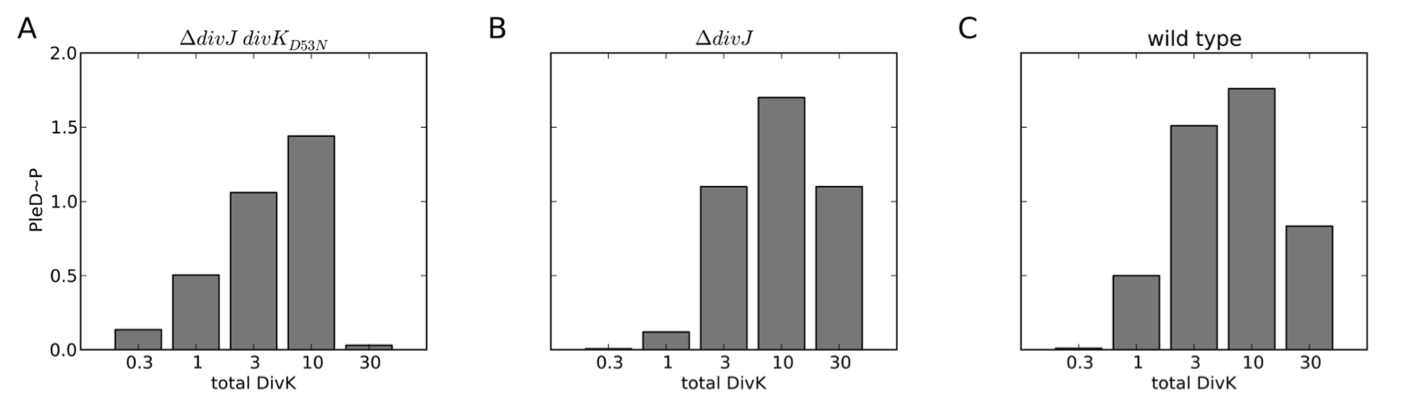
Figure 2.5: Over-expressing DivK causes a drop in PleD phosphorylation. The steady state level of PleD~P is plotted against increasing amount of total DivK for (A) ΔdivJ divKD53N, (B) ΔdivJ, and (C) wild type background. Although the absolute levels vary among the three cell types, in each case PleD~P level shows an initial increase followed by a drop at high DivK.
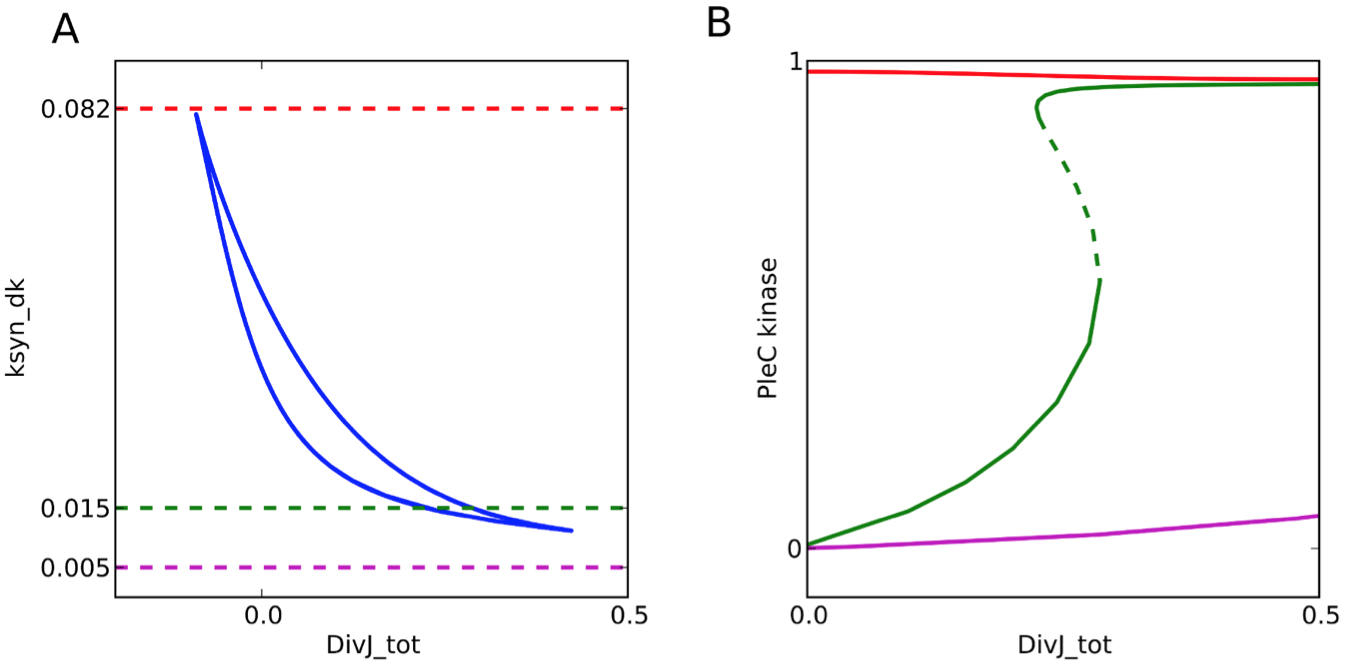
Figure 2.6: Over-expressing DivK causes activation the PleC switch independent of DivJ. (A) Two-parameter bifurcation diagram, indicating how the PleC switch behaves in cells expressing different levels of DivJ_tot and DivK_total (ksyn_dk is the rate constant for synthesis of DivK). PleC exhibits bistability within the crescent-shaped region bounded by the blue lines. (B) One-parameter bifurcation diagrams (signal-response curves) for three different values of ksyn_dk, indicated by the dashed hoizontal lines in panel A. Notice that PleC kinase level is always low if ksyn_dk<0.011 and always high if ksyn_dk>0.082.
3. The PleC-DivJ-DivK switch confers bistability to the DivL-CckA-CtrA module

Figure 2.7: The DivJ-PleC-DivK module controls the DivL-CckA-CtrA module. When the PleC switch is activated, DivK~P binds to DivL and inactivates components of the CckA module. One parameter bifurcation diagrams show the steady state levels of (A) DivL, (B) CckA kinase, (C) CtrA~P, and (D) CpdR~P as functions of DivJ_tot.
 webmaster